M1問題/M1 exercise
目次/List of exercises
A. スクリプトの作成 / Scripting training
A-1. アミノ酸配列からRNA 配列への変換/Transform an Amino Acid Sequence into RNA sequences
A-2. 制限酵素サイトの検索/Search Restriction Enzyme Sites
B. 解析パイプラインの理解 / Understanding analytical pipeline
B-1 メタゲノム解析の基礎/Basics of metagenomics
B-2 ゲノム解析と系統解析の基礎/Basics of genome and phylogenetic analysis
C. ゲノムネットの理解 / Understanding GenomeNet
C-1. データベースの現状/Current state of database
C-2. DBGET/BLASTデータベースの作成/Create DBGET/BLAST database
C-3. PATHWAY データからのネットワーク特徴量計算/Calculation of network feature quantity from PATHWAY data
D. 発展問題/Advanced exercise
D-1. Mollivirusのトランスクリプトーム解析/Transcriptomic analysis of Molliivirus
D-2. ワインの質の機械学習による予測/Predict quality of wine with machine learning
A-1. アミノ酸配列からRNA 配列への変換/Transform an Amino Acid Sequence into RNA sequences
問題/Problem:
1) Homeobox の antennapedia 型タンパク質はそのアミノ酸配列中に LFPWM という配列パターンを持つことが知られている。アミノ酸配列 LFPWM をコードする RNA 配列のパターンを全て列挙せよ。遺伝コードは Universal genetic code に従うものとする。なお、 LFPWM に限らずあらゆるアミノ酸配列に対応できるようにプログラムを作成せよ。
Homeobox’s antennapedia type protein has a amino acid sequence pattern “LFPWM”. List all possible RNA sequence patterns coding this amino acid sequence pattern. Genetic code shall conform to Universal genetic code. You have to make a program suitable for not only “LFPWM” but also all possible amino acid sequences.
A-2. 制限酵素サイトの検索/Search Restriction Enzyme Sites
問題/Problem:
1) λファージの完全ゲノム(NC_001416)を制限酵素 EcoRI で完全に消化したとき、得られる全ての断片の長さを答えよ。HindIII, BamHI, NotI で消化した場合についても同様に答えよ。制限酵素サイトは REBASE で検索せよ。
When digesting the whole genome sequence of λ phage(NC_001416)completely with EcoRI, how long can each fragment be obtained? How about HindIII, BamHI and NotI? For restriction enzyme sites, please refer to REBASE.
B-1 メタゲノム解析の基礎/Basics of metagenomics
準備/Preparation:
公共データベース(NCBI/EBI/DDBJ)からアクセッション番号DRR125122(ショットガンメタゲノムシーケンス)のfastqファイル(ペアエンドでシーケンスしたもの)をダウンロードせよ。
Download the pair-end-sequenced fastq file of accession number DRR125122 (shotgun metagenome sequence) from the public database (NCBI/EBI/DDBJ).
問題/Problem:
1) DRR125122に紐づけられたBioSample, BioProjectの情報から、これらがどのようなサンプルであるか整理せよ。
From the information in BioSample and BioProject linked to DRR125122, determine the origin of the sample.
2) fastqの上からn個目のリードペアをNCBI nr/ntへのBLASTnおよびUniRef90へのBLASTxで相同性検索し、検索結果を出力するスクリプトを作成せよ。ランダムに選んだ20リード程度をこのスクリプトで検索し、どのような生物に由来する配列が多いか推察せよ。
Create a script that searches the Nth read pair in the fastq files using BLASTn against NCBI nr/nt and BLASTx against UniRef90, and outputs the search results. Search about 20 randomly selected read pairs with this script and guess from which organisms the sequences are likely derived.
3) リードのクオリティコントロールツール(fastp, fastqc, Trimmomatic, Cutadapt等)を用いて、ダウンロードしたfastqのデータ量(総塩基数および総リード数)及び品質(リード長・アダプター配列のコンタミ)を確認し、fastpの”-3 -W 6 -M 20 -q 15 -u 50 -n 0 -p -l 50″ オプションを用いてクオリティコントロール済みのリードを出力せよ。
Check the quantity (read number, base count) and quality (read length, adapter contamination) of the fastq data using readQC tools (e.g., fastp, fastqc, Trimmomatic, Cutadapt) and output quality-controlled reads using fastp with “-3 -W 6 -M 20 -q 15 -u 50 -n 0 -p -l 50” options.
4) metaSPAdesまたはMEGAHITを用いて(3)をデフォルトパラメーターでアセンブルせよ。
Assemble (3) using metaSPAdes or MEGAHIT with default parameters.
5) (4)の結果から、50kb以上のcontigを抽出せよ。
Extract contigs larger than 50 kb from the results of (4).
6) (5)に(3)のリードをマッピング(minimap2, bowtie2, bwa等を使用)し、最もリードカバレッジの高いコンティグを選出せよ。
Map the reads from (3) to the contig selected in (5) (using minimap2, bowtie2, bwa) and select the contig with the highest read coverage.
7) (6)で選んだコンティグの遺伝子予測を行い、得られたアミノ酸配列をNCBI nrまたはUniRef90へのDIAMOND blastpで相同性検索し、 このコンティグが何のゲノム断片に由来するものかを推察せよ。
Predict genes for the contig selected in (6) and search the resulting amino acid sequences against NCBI nr or UniRef90 using DIAMOND blastp, and infer from which organisms the genomic fragment was derived.
発展問題/Advanced exercise
8) kaijuを用いて(3)で得られたリードのKronaプロットを作成し、系統組成を報告せよ。kaijuのデータベースはnr-eukを用いよ(スパコンにインストール済み)。
Make a Krona plot for the reads obtained in (3) using kaiju and report the phylogenetic composition. “nr-euk” should be used as the database for kaiju (already installed on the supercomputer).
9) 公共データベースより任意のシーケンスリードデータをダウンロードし、(3)および(8)の解析を一貫して行いリードクオリティおよび系統組成のレポートを出力するスクリプトを作成せよ。計算時間節約のため、データサイズが大きい場合に最初の100万リードを抽出しダウンサンプリングしてから解析を行う機能を実装せよ。
Create a script that downloads arbitrary sequence read data from public databases, performs the analyses in (3) and (8) consistently, and outputs reports on read quality and phylogenetic composition. To save computation time, implement a feature that downsamples the first 1 million reads when the data size is large, and then performs the analysis.
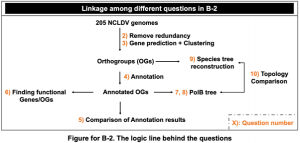
B-2 ゲノム解析と系統解析の基礎/Basics of genome and phylogenetic analysis
準備/Preparation:
NCLDVのゲノム(205個)とそのリストをこちらからダウンロードせよ(パスワードはNCLDV)。
Download the 205 NCLDV genomes and their list here (password: NCLDV).
問題/Problem:
1) 各FASTAファイルのヘッダをスペースの無いID情報のみに変換するスクリプトを作成せよ。IDとファイル名の関係を含むdataframe/listを作成せよ。
Compile a shell script to simplify the sequence names in all downloaded FASTA files so that the sequence names only contain an ID number and no blank space. Make a dataframe/list that includes the relationship between ID and filename from the header.
例/Example: “>MN448303.1 Megaviridae environmental sample isolate oPacV-421 clone oPacV-421_c7 genomic sequence, sequence” ⇒ “>MN448303.1”
2) NCLDV の ゲノム(205個)に対して ゲノムクラスタリングツールを用いてクラスタリングを行い、閾値を 95% ANI に設定して冗長性を削除せよ。
Perform clustering of the 205 NCLDV genomes using clustering tools and remove redundancy by setting the threshold of 95% ANI.
3) (2)で出力されたゲノムの遺伝子予測を行い、得られたアミノ酸配列に対し別々のオルソグループ(OG)にクラスタリングせよ。
Perform gene prediction of the genomes obtained in (2) and cluster those genes into different orthogroups (OGs).
4) (3)で出力されたオルソグループ(OG)に対しGhostKOALAおよびKofamKOALAを用いてKEGG Orthology (KO)番号をアサインせよ。同一OG内の複数の遺伝子に異なるKO番号がアサインされる場合は、高頻度で登場する(例えば50%以上の遺伝子がアサインされる)KOがあればそれを代表として用いよ。そのようなKOが存在しない場合は、アノテーションは行わないこと(ミスアノテーションを防ぐため)。
Assign a KEGG Orthology (KO) number to each resulting OGs acquired from (3) using GhostKOALA and KofamKOALA. You may get different KO numbers for different genes in one OG. KO number can be assigned to the OG if most (e.g., >50%) of the genes in the OG had the same KO number. In case such a KO does not exist, leave the OG as unannotated to avoid misannotation.
5) (4)で得られたGhostKOALAとKofamKOALAの結果を比較し、アノテーション結果が一致するOGの割合を報告せよ。
Compare the results of GhostKOALA and KofamKOALA obtained in (4) and report the percentage of OGs for which the annotation results are consistent.
6) (4)のいずれかの結果からKEGGカタログ(https://www.kegg.jp/brite/ko00001 )を参照して”Metabolism”に属しているKOを抽出し、各NCLDV FamilyにおけるMetabolismごとの KO数を統計せよ。KEGGカタログはスパコン上の”/bio/db/kegg/ko/ko”からも取得できることを確認せよ。
From the result of (4), extract KOs belonging to “Metabolism” by referring to the KEGG catalog (https://www.kegg.jp/brite/ko00001 ) and report the number of KOs for each Metabolism in each NCLDV Family. Confirm that the data can also be accessed from “/bio/db/kegg/ko/ko” on the supercomputer.
7) (4)の結果から、 DNA polymerase family B (PolB)遺伝子のOGを選択せよ。1つのゲノムに対して、PolB遺伝子は1つのみであることを確認せよ。(当該配列が複数存在する場合は最も長いものを代表として抽出せよ)。
Extract the OG annotated as DNA polymerase family B (PolB) gene from the results of (4). Make sure that for one genome there’s only one PolB gene. (if there are multiple PolB sequences, select the longest one).
8) 抽出したPolBアミノ酸配列のマルチプルアライメントを行い、PolB遺伝子の系統樹を作成せよ。結果はiTOL上で可視化し、枝をfamily レベルでラベル付けせよ。
Perform multiple alignments of the extracted PolB amino acid sequences and create a phylogenetic tree of the PolB gene. Visualize the results on iTOL and label branches at the family level.
発展問題/Advanced exercise
9) (3)の結果より、ncldv_markersearchを用いて、各ゲノムのPolB, DNA-directed RNA polymerase alpha subunit (RNAPL), DNA topoisomerase II (TopoII)遺伝子のアミノ酸配列を取得せよ。
From the results of (3), obtain the amino acid sequences of the PolB, DNA-directed RNA polymerase alpha subunit (RNAPL), and DNA topoisomerase II (TopoII) genes for each genome using ncldv_markersearch.
10) 取得した3遺伝子のアミノ酸配列をゲノムごとに結合し、マルチプルアライメントを行って系統樹を作成し、(7)で作成したPolBのみの系統樹とトポロジーを比較せよ。
Concatenate the amino acid sequences of the three genes for each genome, perform multiple sequence alignment, create a phylogenetic tree, and compare the topology with the PolB-only phylogenetic tree created in (7).
C-1. データベースの現状/Current state of database (An access to the supercomputer is required)
問題/Problem C-1-1:
1) KEGG GENOME の塩基配列データ(スパコン:/bio/db/fasta/genome/)と KEGG GENES の遺伝子配列データ(スパコン:/bio/db/fasta/genes/)を読み込み、各ゲノム(T番号毎)の総塩基数とタンパク質コーディング遺伝子の数をカウントせよ。また、横軸をゲノムサイズ、縦軸をタンパク質コーディング遺伝子の数とするプロットを作成せよ。
Read the base sequence data of KEGG GENOME (supercomputer:/bio/db/fasta/genome/) and the gene sequence data of KEGG GENES (supercomputer:/bio/db/fasta/genes/) and count the total number of bases and protein-coding genes of each genome (T number). Also, create plots with the genome size on the horizontal axis and the number of protein-coding genes on the vertical axis.
2) 次に、 スパコン:/bio/db/ideas/genome/ から生物種名、ゲノムサイズ、遺伝子数を取得して表を作成し、上記のカウントと合うかを確かめよ。
Next, obtaine species name, genome size, number of genes from supercomputer:/bio/db/ideas/genome/ and create the table of them. Also, check if the genome size and number of genes of each genome matches the above count.
問題/Problem C-1-2:
スパコン:/bio/db/ideas/ にはゲノムネットでサービスしているデータベースがある。このうち、以下のデータベースについて、そのエントリー数をカウントして、表にせよ。また、それぞれのデータベースの内容について簡単にまとめよ。
supercomputer:/bio/db/ideas/ has a database serving on the GenomeNet. Among them, count the number of entries for the following databases and tabulate them. Also, report what kind of contents databases have. (eg. “RefSeq is manually curated database for non-redundant set of sequences provided by NCBI. That includes genomic DNA, transcripts, and proteins.” Please report like this!!)
RefSeq, PDB, SWISS-PROT, TrEMBL, PFAM, NCBI-CDD, PATHWAY, MODULE, KO, COMPOUND, ENZYME, REACTION, DRUG, DISEASE
C-2. DBGET/BLASTデータベースの作成/Create DBGET/BLAST database (An access to the supercomputer is required)
問題/Problem C-2-1:
DBGET の bfind コマンドを用いて KEGG GENES(スパコン:/bio/db/fasta/genes/)から自分の興味のある遺伝子(例:ribosome)をキーワード検索で抜き出せ。そして、seqnew コマンドを用いて DBGET データベースを作成せよ。作成したデータベースから bget コマンドでエントリを取得できることを確認せよ。
Extract the gene of your interest (eg. ribosome) from KEGG GENES (supercomputer:/bio/db/fasta/genes/) by keyword search using bfind command in DBGET. Then, create DBGET database using seqnew command.
From the database you created, make sure you can get entries with bget command.
問題/Problem C-2-2:
1) DBGET の bfind コマンドを用いて KEGG GENES から自分の興味のある遺伝子をキーワード検索で抜き出し、FASTA 形式で保存せよ。そして、BLAST+ の makeblastdb を用いて BLAST データベースを作成せよ。作成したデータベースから blastdbcmd コマンドでエントリを取得できることを確認せよ。
Extract the gene of your interest from KEGG GENES by keyword search using seqnew command and save it in FASTA format. Then, create BLAST database using makeblastdb command in BLAST+. From the database you created, make sure you can get entries with blastdbcmd command.
2) 次に、好きな配列をクエリとして、作成したデータベースに対して BLAST 検索し、上位10個の配列のFASTAファイルを作成せよ。
Next, Using the sequence of your interest as a query, search BLAST against the created database and make the FASTA file of top 10 sequences.
[DBGET help] -h オプションで簡略な、man コマンドで詳細なヘルプを表示できるので活用してください。
Please see help as it appears in -h option (brief help) or man command (detail help).
[BLAST+ help] -h オプションで簡略な、-help コマンドで詳細なヘルプを表示できるので活用してください。下の公式マニュアルも役に立ちます。
Please see help as it appears in -h option (brief help) or -help option (detail help). The official manual below is also useful.
BLAST command line applications user manual (pdf)
C-3. PATHWAY データからのネットワーク特徴量計算/Calculation of network feature quantity from PATHWAY data
準備/Preparation:
大腸菌 の KEGG PATHWAY データを下記から取得してください。KEGGのデータは外部と共有禁止です。
Please obtain the KEGG PATHWAY dataset of E. coli from the following directories. Sharing KEGG data with outisde is strictly prohibited.
ecoXXXXX.rn: /srv/www/pub/kegg/pathway/eco
ecoXXXXX.xml: /srv/www/pub/kegg/xml/kgml/metabolic/organisms/eco
reaction: /bio/db/kegg/reaction
compound: /bio/db/kegg/reaction
問題/Problem:
1) 大腸菌 KEGG PATHWAY データから化合物の二項関係(反応の基質と生成物の関係)を抽出せよ。
Extract the binomial relationship of the compound (the relationship between the substrate of the reaction and the product) from the KEGG PATHWAY dataset of E. coli.
2) 次に、各化合物の次数(いくつの化合物と関係があるか)を計算し、そのヒストグラムを作成せよ。
Next, calculate the degree of each compound (how many compounds are related) and create a histogram of that.
3) そして、抽出した二項関係が構成するネットワークにいくつの連結成分があるかを計算せよ。また、各連結成分のサイズ(何個の化合物が含まれるか)も計算せよ。その結果から、サイズごとの連結成分の個数をヒストグラムとして表せ。
Then, calculate how many connected components are in the network constructed with binary relation. Also calculate the size of each connected component (how many compounds in it). From the result, create a histogram of the size of the connected component.
D-1. Mollivirusのトランスクリプトーム解析/Transcriptomic analysis of Molliivirus
準備/Preparation:
NCBIの Sequence Read Archive (SRA) で SRX1078581 と検索すると、この問題で使用するMollivirusのRNA-seqデータが3つ表示されます。これらのデータを SRA Toolkit の prefetch コマンドを使用してダウンロードし、fastq-dump コマンドで FASTQ 形式に変換してください。またMollivirusの参照ゲノム(NC_027867)並びに宿主 Acanthamoeba castellanii のゲノムアセンブリ(GCF_000313135.1)を FASTA 形式でダウンロードし、これら2つのゲノムを1つのファイル(multi-FASTA 形式)に統合してください。
You can find RNA-seq data of Mollivirus with ID:SRX1078581 in NCBI Sequence Read Archive (SRA). Then please get those data using prefetch command of SRA Toolkit and convert them into FASTQ format with fastq-dump command. Next, please download the referance genome of Mollivirus (NC_027867) and a genome assembly of its host Acanthamoeba castellanii (GCF_000313135.1) in FASTA format and merge these two genomes in one file (i.e. multi-FASTA format).
問題/Problem:
1) それぞれのシークエンスデータをMollivirusとアメーバの統合リファレンスゲノムにマッピングせよ(ツール例:HISAT2、STAR)。マップされたリード数、マップされたリードの割合、Mollivirusゲノムにマップされたリード数、Mollivirusにマップされたリード数とアメーバゲノムにマップされたリード数の比率を算出してグラフで表示せよ。
Do genome mapping against integrated reference genome of Mollivirus and A.castellanii. calculate the number of mapped reads, the ratio of mapped reads, the number of reads mapped to Mollivirus genome, the number of reads mapped to A.castellanii and the ratio of reads mapped to Mollivirus or A.castellanii.
2) Integrative Genomics Viewer (IGV) でマッピング結果を可視化できる。発現していると思われるMollivirusの遺伝子を一つ選び、遺伝子の発現量を時系列順に並べて表示し、そのスクリーンショットを示せ。スパコンでIGVを起動するにはsshコマンドで-Yオプションが必要になる。
You can visualize the result of genome mapping. please choose a annotated gene and show the results in the order of time scale. You can use IGV on the supercomputer, but you need -Y option with ssh command.
3) アノテーションファイルを使用して、2)で選んだ遺伝子の転写量をFPKMで正規化してグラフ表示せよ。
Calculate FPKM of the gene you chose.
[Reference] Legendre M, et al. In-depth study of Mollivirus sibericum, a new 30,000-y-old giant virus infecting Acanthamoeba. Proc Natl Acad Sci U S A. 2015. 112(38):E5327-35 doi:10.1073/pnas.1510795112
D-2. ワインの質の機械学習による予測/Predict quality of wine with machine learning
準備/Preparation:
Wine Quality Datasetsよりwinequality.zipをダウンロードして解凍してください。この問題ではデータセットwinequality-white.csvを使います。このデータセットはポルトガルのワイン「ヴィーニョ・ウェルデ」(Vinho Verde)の白ワインボトルの評価の結果です。第1列から第11列までは物理化学量の測定値、第12列は専門家によるワインの質の評価です。この問題を解くには、Python ユーザなら機械学習パッケージ scikit-learn を使うと便利です。
Please download “winequality.zip” from Wine Quality Datasets and unzip it. A dataset “winequality-white.csv” is used in this problem. This dataset is the result of evaluation of bottles of Portuguese white wine “Vinho Verde”. The 1st column to the 11th columns are meseurements of the physicochemical parameters and the 12th column is the quality of wine evalueted by experts. The machine learning package “scikit-learn” is convinient for solving this problem if you are Python user.
問題/Problem:
1) 白ワインデータセットの散布図行列を作れ。散布図行列により特徴量同士の相関関係をまとめて可視化できる。
Create a scatterplot matrix of the white wine dataset. The scatterplot allows us to visualize the pair-wise correlation between the different features in one place.
2) ワインの質を物理化学量から予測したい。まずワインの質の列を、7から10までを良いワイン(陽性クラス)、1から6までを悪いワイン(陰性クラス)の2クラスに変換せよ。次に、全サンプルの70%を学習セット、30%をテストセットに分割せよ。そして、物理化学量の列を入力特徴量として用いてワインの質(良いか悪いか)を予測するサポートベクトルマシン(SVM)を学習せよ。テストセットでの正答率と混同行列を報告せよ。入力特徴量は標準化すること(平均を0、標準偏差を1に合わせる)。ハイパーパラメータはグリッドサーチによりチューニングすること。
We want to predict the quality of wine based on the physicochemical parameters. First, convert the column of quality to two classes like: 7 to 10 is good wine (a positive class) and 1 to 6 is bad wine (a negative class). Next, split the dataset into a training set (70% of all samples) and a test set (30% of all). Then, use columns of the physicochemical parameters as input features to train a Support Vector Machine (SVM) to predict the quality of wines (good or bad). Report accuracy and a confusion matrix on the test set. Input features should be standardized (centered at mean zero with standard deviation one). Hyperparameters should be tuned via grid search.
3) テストセットでの受信者動作特性(ROC)曲線を描け。ROC曲線の計算には決定関数の返り値を使う。
Plot a ROC (Reciever Operating Characteristic) curve on the test set. Return values of decision function will be used for creating a ROC curve.
4) 各入力特徴量の相対重要度を計算し、棒グラフにせよ。相対重要度は次のように定義される。
Calculate relative importance of each input feature and plot bar graph of them. Relative importance is defined as below.
相対重要度の定義/Definition of relative importance: Definition of relative I
importance (pdf)
[Reference] Cortez P, et al. Modeling wine preferences by mining from physicochemical properties. 2009. Decis Support Syst 47:547-53 doi:10.1016/j.dss.2009.05.016